2D Views and Maps
Understanding Geosoft Maps and Views
Geosoft maps are used to present geoscience information on a 2D surface, which can be a computer screen or printed on paper.
- Geosoft Maps are stored in a file that has a descriptive name and an extension .map.
- A Map can be thought of as a physical piece of paper, and we use map centimeters or map millimetres to reference locations relative to the bottom-left corner, which is location (0,0).
- A Map contains Views, and a Map may have any number of Views.
- A View represents some spatial extent within a defined Earth coordinate system that is scaled and located as desired on the surface of the map.
- Views can be 2D or 3D, with 3D views rendered on a map as a 2D perspective of the information in the 3D View..
- Views contain named Groups, with each Group containing a set of graphical elements that display spatial information. Basic drawing Groups contain lines, coloured areas and text. More advanced Group types support more complex data structures like Aggregates for grids and images, Voxels that display a Geosoft voxette, or a CSymb Group that contains data points coloured by size based on a data value.
- 3D Views can contain 3D Groups, such as a something drawn on a relief surface, or a 3D Geosoft Geosurface, or a set of vectors from a Geosoft Vector voxel.
- Geosoft Maps can be opened and viewed in a Geosoft Viewer.
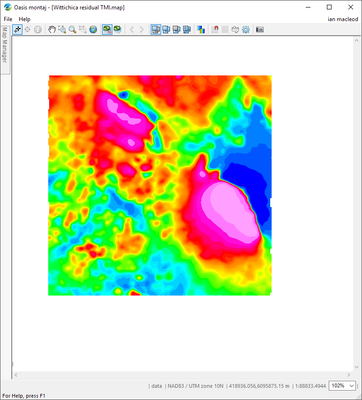
Display a grid on a map
One of the most common tasks is to display a data grid in colour:
import geosoft.gxpy.gx as gx
import geosoft.gxpy.map as gxmap
import geosoft.gxpy.view as gxview
import geosoft.gxpy.group as gxgroup
import geosoft.gxpy.agg as gxagg
import geosoft.gxpy.grid as gxgrd
import geosoft.gxpy.viewer as gxviewer

gxc = gx.GXpy()

# create a map from the grid coordinate system and extent
with gxgrd.Grid('Wittichica Creek Residual Total Field.grd') as grd:
    grid_file_name = grd.file_name_decorated

    # create a map for this grid on A4 media, scale to fit the extent
    with gxmap.Map.new('Wittichica residual TMI',
                       data_area=grd.extent_2d(),
                       media="A4",
                       margins=(1, 3.5, 3, 1),
                       coordinate_system=grd.coordinate_system,
                       overwrite=True) as gmap:
        map_file_name = gmap.file_name

# draw into the views on the map. We are reopening the map as the Aggregate class only works with a closed grid.
with gxmap.Map.open(map_file_name) as gmap:

    # work with the data view
    with gxview.View.open(gmap, "data") as v:

        # add the grid image to the view
        with gxagg.Aggregate_image.new(grid_file_name) as agg:
            gxgroup.Aggregate_group.new(v, agg)

# display the map in a Geosoft viewer
gxviewer.view_document(map_file_name, wait_for_close=False)
Add Contours and Shading
Now we will improve the script by adding contour lines and a shading effect. We will also make a double-line outer-contour.
import geosoft.gxpy.gx as gx
import geosoft.gxpy.map as gxmap
import geosoft.gxpy.view as gxview
import geosoft.gxpy.group as gxgroup
import geosoft.gxpy.agg as gxagg
import geosoft.gxpy.grid as gxgrd
import geosoft.gxpy.viewer as gxviewer

gxc = gx.GXpy()

# create a map from grid coordinate system and extent
with gxgrd.Grid('Wittichica Creek Residual Total Field.grd') as grd:
    grid_file_name = grd.file_name_decorated

    # create a map for this grid on A4 media, scale to fit the extent
    with gxmap.Map.new('Wittichica residual TMI',
                       data_area=grd.extent_2d(),
                       media="A4",
                       margins=(1, 3.5, 3, 1),
                       coordinate_system=grd.coordinate_system,
                       overwrite=True) as gmap:
        map_file_name = gmap.file_name

# draw into the views on the map. We are reopening the map as the Aggregate class only works with a closed grid.
with gxmap.Map.open(map_file_name) as gmap:

    # work with the data view, draw a line around the data view
    with gxview.View.open(gmap, "data") as v:

        # add the grid image to the view, with shading, 20 nT contour interval to match default contour lines
        with gxagg.Aggregate_image.new(grid_file_name, shade=True, contour=20) as agg:
            gxgroup.Aggregate_group.new(v, agg)

		# contour the grid
        gxgroup.contour(v, 'TMI_contour', grid_file_name)

# display the map in a Geosoft viewer
gxviewer.view_document(map_file_name, wait_for_close=False)
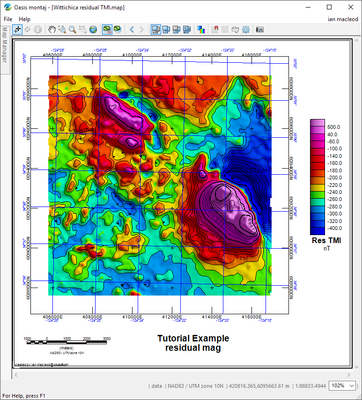
Location Reference, Scale Bar, Colour Legend and Title
Now we will improve the map my adding location reference annotations, a scale bar, colour legend and map title.
import geosoft.gxpy.gx as gx
import geosoft.gxpy.map as gxmap
import geosoft.gxpy.view as gxview
import geosoft.gxpy.group as gxgroup
import geosoft.gxpy.agg as gxagg
import geosoft.gxpy.grid as gxgrd
import geosoft.gxpy.viewer as gxviewer

gxc = gx.GXpy()

# create a map from grid coordinate system and extent
with gxgrd.Grid('Wittichica Creek Residual Total Field.grd') as grd:
    grid_file_name = grd.file_name_decorated

    # create a map for this grid on A4 media, scale to fit the extent
    with gxmap.Map.new('Wittichica residual TMI',
                       data_area=grd.extent_2d(),
                       media="A4",
                       margins=(1, 3.5, 3, 1),
                       coordinate_system=grd.coordinate_system,
                       overwrite=True) as gmap:
        map_file_name = gmap.file_name

# draw into the views on the map. We are reopening the map as the Aggregate class only works with a closed grid.
with gxmap.Map.open(map_file_name) as gmap:

    # work with the data view, draw a line around the data view
    with gxview.View.open(gmap, "data") as v:

        # add the grid image to the view, with shading, 20 nT contour interval to match default contour lines
        with gxagg.Aggregate_image.new(grid_file_name, shade=True, contour=20) as agg:
            gxgroup.Aggregate_group.new(v, agg)

            # colour legend
            gxgroup.legend_color_bar(v, 'TMI_legend',
                                     title='Res TMI\nnT',
                                     location=(1.2,0),
                                     cmap=agg.layer_color_map(0),
                                     cmap2=agg.layer_color_map(1))

        # contour the grid
        gxgroup.contour(v, 'TMI_contour', grid_file_name)

    # map title and creator tag
    with gxview.View.open(gmap, "base") as v:
        with gxgroup.Draw(v, 'title') as g:

            g.text("Tutorial Example\nresidual mag",
                   reference=gxgroup.REF_BOTTOM_CENTER,
                   location=(100, 10),
                   text_def=gxgroup.Text_def(height=3.5,
                                             weight=gxgroup.FONT_WEIGHT_BOLD))
            g.text("created by:" + gxc.gid,
                   location=(1, 1.5),
                   text_def=gxgroup.Text_def(height=1.2,
                                             italics=True))

    # add a map surround to the map
    gmap.surround(outer_pen='kt500', inner_pen='kt100', gap=0.1)

    # annotate the data view locations
    gmap.annotate_data_xy(grid=gxmap.GRID_CROSSES)
    gmap.annotate_data_ll(grid=gxmap.GRID_LINES,
                          grid_pen=gxgroup.Pen(line_color='b'),
                          text_def=gxgroup.Text_def(color='b',
                                                    height=0.15,
                                                    italics=True))
    # scale bar
    gmap.scale_bar(location=(1, 3, 1.5),
                   text_def=gxgroup.Text_def(height=0.15))

# display the map in a Geosoft viewer
gxviewer.view_document(map_file_name, wait_for_close=False)
Save Map as an Image File
Maps can be saved as image files in a number of formats. This can be useful to produce high-quality images to be included in reports or other graphical applications.
To do this use the geosoft.gxpy.map.save_as_image() function, which can be added to the end of the last program script, This will create a default 1000 pixel-wide image, though the desired image size can be adjusted using the pix_width= or pix_height= function arguments.
# save to a PNG file
gxmap.save_as_image(map_file_name, "wittichica_mag.png", type=gxmap.RASTER_FORMAT_PNG)


