Debugging with PyCharm
Debugging a stand-alone script
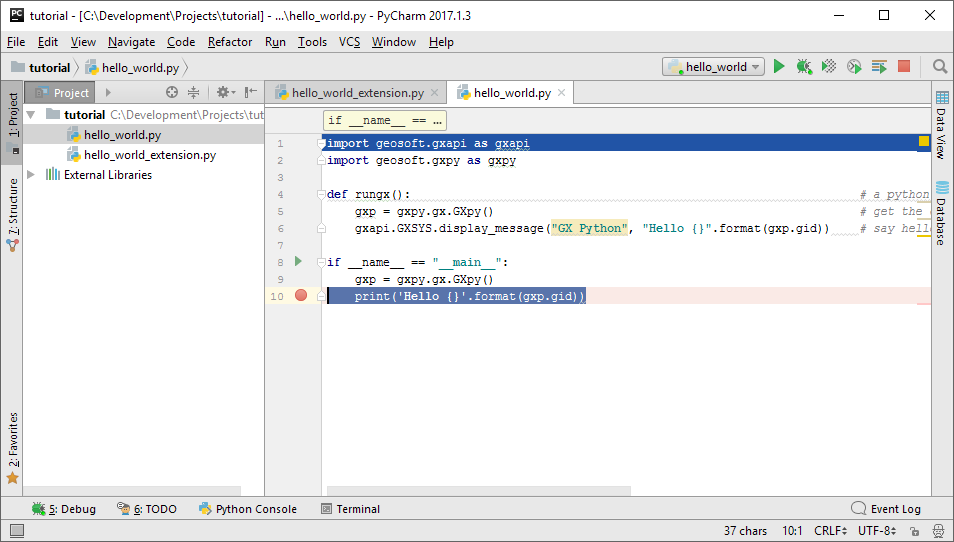
We will debug the combined extension and stand-alone script from the Hello World lesson. To do this, open a PyCharm session and set a breakpoint next to the print statement at line 10. To toggle breakpoints click in the margin immediately left of the line at which to break and a red circle will appear/disappear, and if present execution breaks before executing this line:
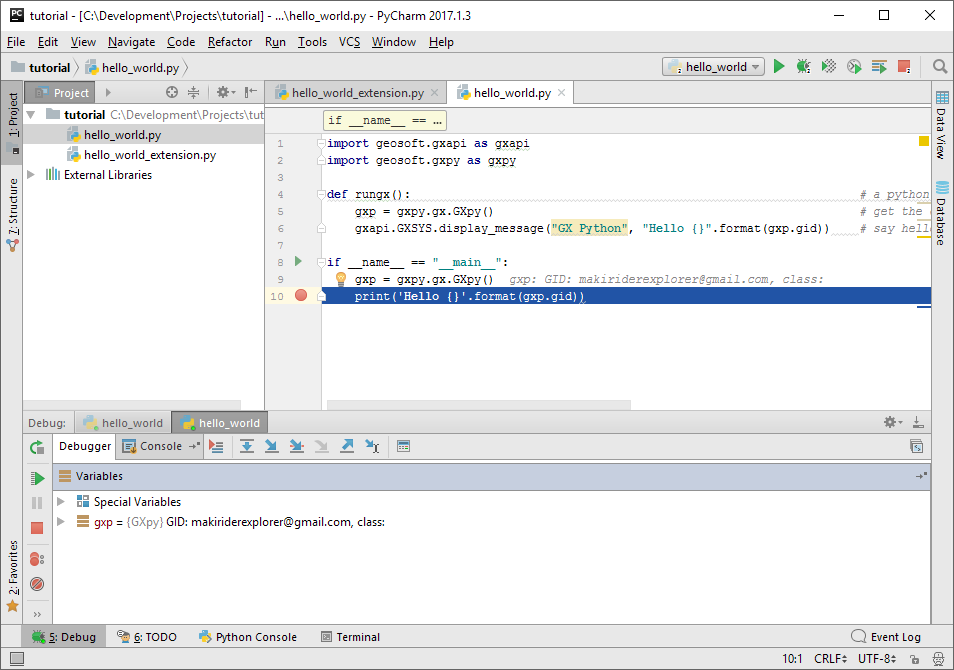
We will break here to inspect the content of the gxp variable. To debug the script, click on the button in the top-right tool-bar. This will open a debug window, run the script and break at line 10:
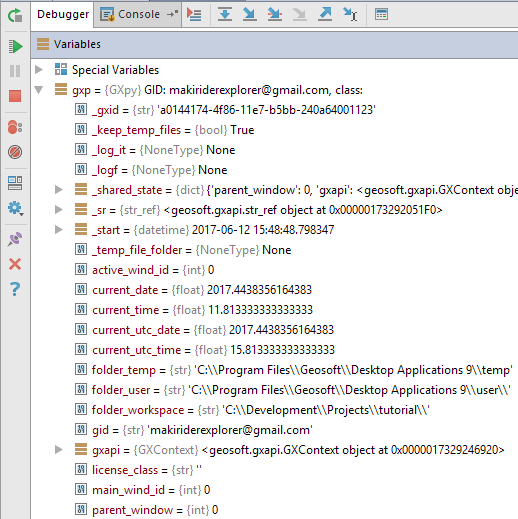
The debugger window has two tabs: Debugger, which allows you to inspect in-context variables, and Console, which shows you console output. In this case we have just created a GX context and we can open the context properties (select the chevron left of the gxp variable) to see all the properties of the GX Context. This is very helpful way to show you what is inside any Geosoft class during a debugging session. For example you can see your Geosoft ID as the string property gid:
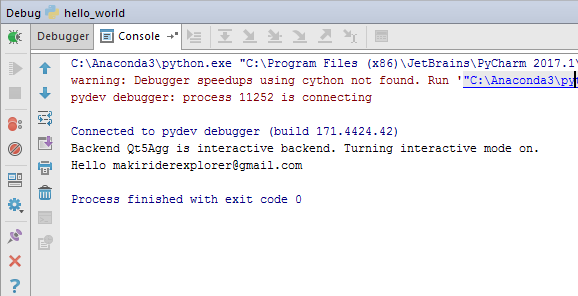
Select the Resume Program chevron to continue. In the Console tab you will see the output of the print statement:
Debugging an extension
Debugging an extension from PyCharm requires a JetBrains Toolbox Subscription to support the hooks for the pydevd package. Should you be using PyCharm or some other IDE debugger that supports pydevd you will find this section helpful.
Because Python extensions are run from Geosoft Desktop (Oasis montaj), interactive debugging of a Python script requires use of a remote debugging hook from the pydevd package. You will first need to add pydevd to your Python environment. Open a command line and from your Python environment:
C:\Anaconda3>Scripts\pip install pydevd
Collecting pydevd
  Downloading pydevd-1.0.0-py3-none-any.whl (1.1MB)
    100% |████████████████████████████████| 1.1MB 983kB/s
Installing collected packages: pydevd
Successfully installed pydevd-1.0.0
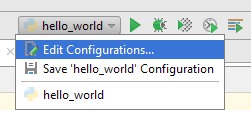
To create a debugging session from PyCharm, add a "Remote debugging" configuration to your project by selecting the Edit Configurations... item from the configurations drop-down:
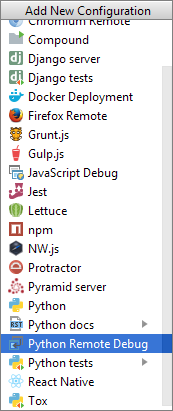
Then add a new configuration, and select Python Remote Debug:
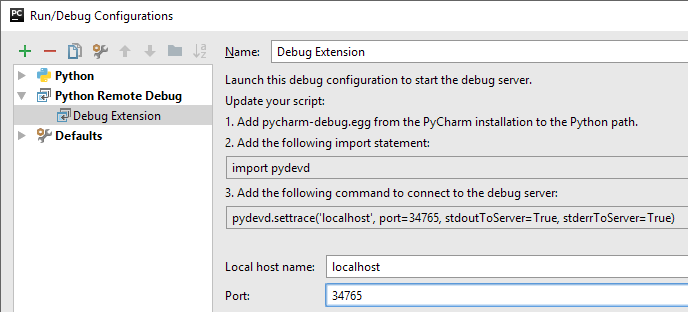
Name this configuration "Debug Extension", and enter port number 34765, which will be the port used to communicate with PyCharm. You may choose any port number above 34567 so long as the port is not used for any other purpose, and the port number you choose must match the port= setting specified in the pydevd.settrace() call in the python script to be debugged.
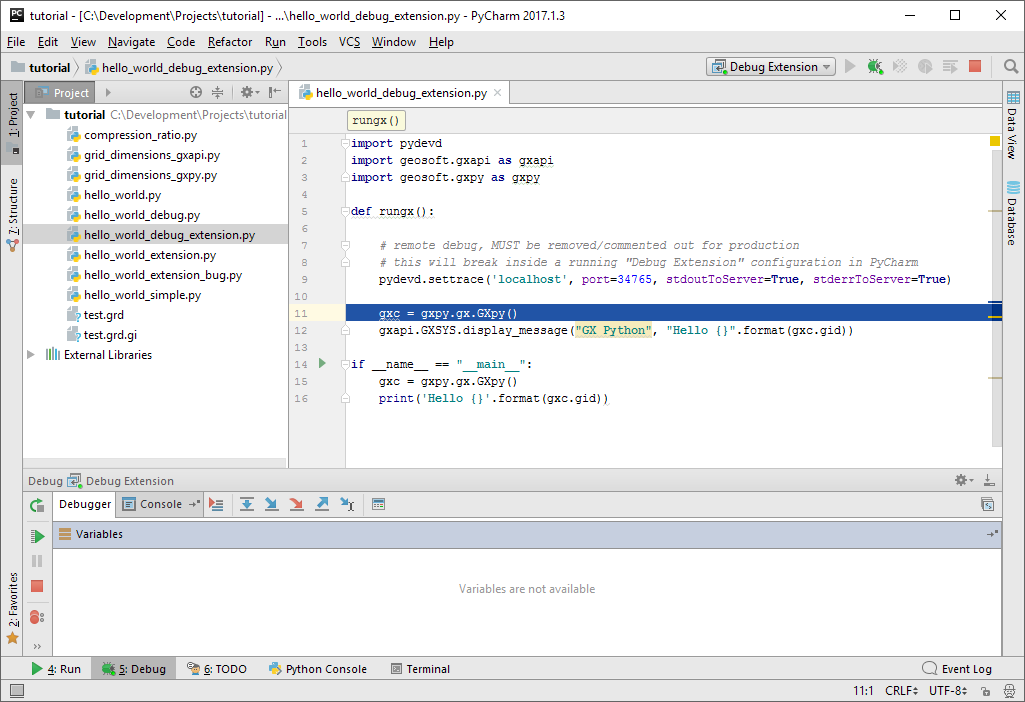
Now, when you debug the "Debug Extension" configuration in PyCharm, the debugger will wait for your extension to call the pydevd.settrace() method and will break on the next line in your script:
pydevd.settrace('localhost', port=34765, stdoutToServer=True, stderrToServer=True)
Place this line in the rungx() method (line 8 below), and add import pydevd to the import section of the script:
import pydevd
import geosoft.gxapi as gxapi
import geosoft.gxpy as gxpy
def rungx():
    # remote debug, MUST be removed/commented out for production
    # this will break inside a running "Debug Extension" configuration in PyCharm
    pydevd.settrace('localhost', port=34765, stdoutToServer=True, stderrToServer=True)
    gxc = gxpy.gx.GXpy()
    gxapi.GXSYS.display_message("GX Python", "Hello {}".format(gxc.gid))
if __name__ == "__main__":
    print('Hello {}'.format(gxpy.gx.GXpy().gid))
Run the debugger using the Debug Extension configuration, which will open a debugger window and wait for the pydevd.settrace() call:
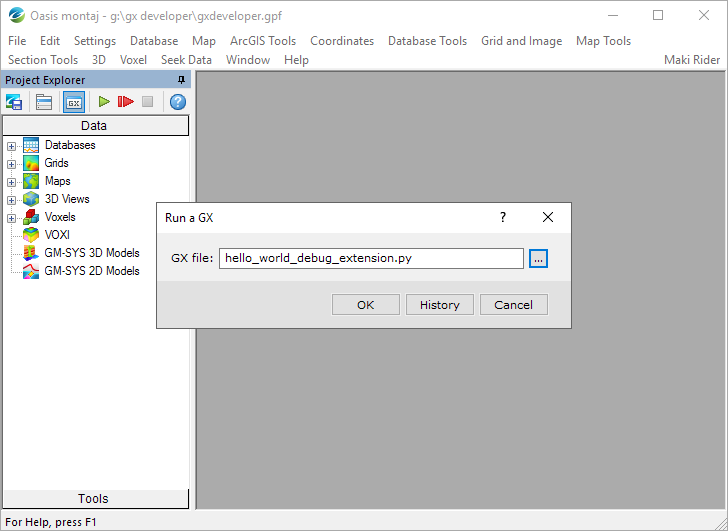
Now we will run the extension from Oasis montaj.
When the pydevd.settrace() method is called the PyCharm debugger will catch the execution and break on the next line. You can then step through and debug your program as required, all within the context of the running Oasis montaj:
F7 will step into a function, F8 will step to the next line, and when done terminate the Debug Extension session by pressing Ctrl + F4. Note that you may have to restart PyCharm or Oasis montaj should the application and debug session become unsynchronized (see below).
